OakPlot Examples
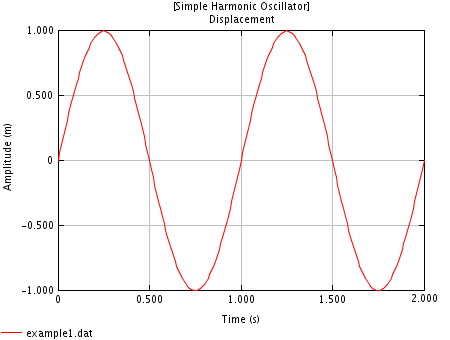
Example 1 - Simple Harmonic Oscillator
The following commands in OakPlot results in the plot below:
- plot "example1.dat" u 1:2 w l
- set xlabel "Time (s)"
- set ylabel "Amplitude (m)"
- set title "[Simple Harmonic Oscillator]\nDisplacement
- set imgsize 450x340
- save "example1.png"
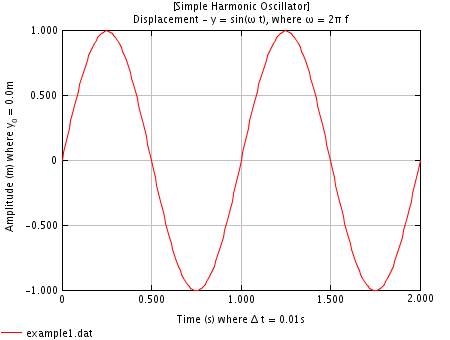
Example 2 - Simple Harmonic Oscillator with Latex Style Strings
The following commands in OakPlot results in the plot below:
- plot "example1.dat" u 1:2 w l
- set xlabel "Time (s) where \Delta t = 0.01s"
- set ylabel "Amplitude (m) where y_0 = 0.0m"
- set title "[Simple Harmonic Oscillator]\nDisplacement - y = sin(\omega t), where \omega = 2\pi f"
- set imgsize 450x340
- save "example2.png"
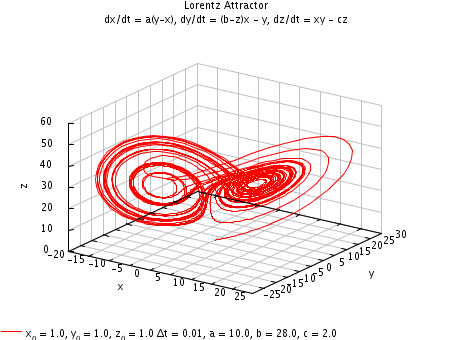
Example 3 - Lorentz Attractor
The following command calls a built-in example of OakPlot and results in the plot below:
- lorentz
- set imgsize 450x340
- save "lorentz.png"
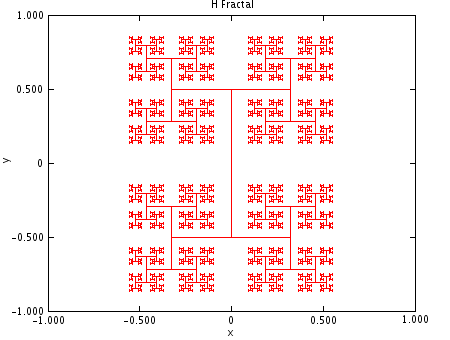
Example 4 - H-Fractal
The following command calls a built-in example of OakPlot and results in the plot below:
- H-fractal
- set imgsize 450x340
- save "h-fractal.png"
Example 5 - 2D Conotur Plot
The following command calls a built-in example of OakPlot and results in the plot below:
- sine-contour
- set imgsize 450x340
- save "sine-contour.png"
